Keeping You Informed Matters
Annual Investment Review January 2026
2025 was a strong year for investors, but not an easy one to navigate. Markets rose despite persistent geopolitical tension, political noise and shifting economic narratives, rewarding disciplined, diversified portfolios over reactive decision-making. In this review, we reflect on the themes that shaped markets, how our strategies responded, and why patience and process mattered more than headlines.
The Outlook
2025 was a good year for investors. Stock markets around the world performed well, with some doing very well. Bonds generated income, albeit with more muted capital returns. Precious metal prices stormed higher. Yet these gains accrued amidst trade and tariff disputes, geopolitical conflict, widespread disappointment with our politicians, and a pervasive sense of gloom amongst consumers in the USA, China, Japan and Europe. It was difficult to map from the news-flow to asset prices, and easy for investors to make mistakes whenever they reacted to news. Despite many news-related ‘icebergs’, all of our portfolio types did well. Every mandate rose in value and beat its benchmark by some margin. We’ll examine some of the reasons for this, while taking a look at the main news and market narratives.
What just happened?
It’s now over three years since ChatGPT’s public launch, and Artificial Intelligence (AI) still dominates conversations amongst investors and businesses. Despite years of practice with AI chatbots, and the launch of many AI applications, we still don’t know exactly how AI will impact work, productivity, profitability or even society in the medium term. With predictions ranging from expectations of unbounded wealth through to human extinction, we’re still very much guessing.
In the meantime, there has been rapid, widespread adoption of AI tools, alongside huge spending on specific types of micro-chips, on data centres and the power supplies for these centres. 2025 saw an acceleration in capital investment, but also the emergence of more complex financing structures, including cross-shareholdings between AI firms and increased off-balance sheet funding.
We’ve observed a subtle narrative shift over the past year, away from the dominant themes of growth and upside potential, and towards some scepticism over likely future returns on announced projects. This AI narrative shift is bringing the focus on to execution risk, balance sheets, and returns on capital employed. In his 2019 book, Narrative Economics, Robert Shiller argues that “popular narratives gone viral have economic consequences.”
In other words, these narrative shifts matter. However, 2026 could well see stock market listings for a number of AI firms, including ChatGPT’s owner, OpenAI. This will almost certainly generate attention and excitement and could counter the growing scepticism around AI. We’re watching closely. In the meantime, portfolios have some AI holdings, mostly via index funds, but much less exposure than the market as a whole.
After AI, perhaps the next most influential factor in markets last year was the expectation – and eventually the reality – of cuts in US policy interest rates. Rate cuts usually benefit borrowers and are often thought to boost market liquidity and ‘animal spirits’. The US President knows this and has exerted considerable pressure on the US Federal Reserve to cut rates, despite inflation remaining firmly above the Central Bank’s target range. Stock markets enjoyed the monetary stimulus. Bond markets were more muted, with long-dated bond yields largely unresponsive to reductions in shorter-dated rates. Other central banks often take their cue from the Federal Reserve, and unsurprisingly, we saw policy rate cuts elsewhere, including the EU, UK and Canada. The main exception was Japan, with rates gradually rising from their low base, as inflation remained doggedly above target.
Usually, when interest rates fall more in one country than in others, bank deposits or bonds in that country become relatively less attractive, and the currency weakens. And, indeed, the US Dollar fell against a basket of other currencies, including Sterling, the Euro and several emerging-market currencies. What’s surprising is that the Japanese Yen weakened alongside the Dollar, even though Japanese rates were rising while Dollar rates fell. Yen weakness was even more surprising, given how undervalued it appears to be. According to the ‘Big Mac Index’* of price comparisons across countries, the Yen could rise almost 80% against the Dollar just to reach fair value.
*Big Mac Index: This index is a simple way of comparing currency values by looking at how much the same McDonald’s Big Mac costs in different countries, helping to show whether a currency appears cheap or expensive relative to others.
Gold was the best performing major asset class in 2025, rising over 50% in Sterling terms. What is fascinating about this surge is that there’s no settled narrative on why the price of gold went up so much. It last performed this well in 1979, during an oil price surge and inflation shock. But last year, oil prices fell sharply (Brent Crude slumped by a quarter in Sterling terms) and inflation has been moderating in most large economies… so current inflation is unlikely to be the cause of gold’s strength. Gold is often considered to be the ultimate haven asset, where investors can go to shelter from financial storms. Maybe risk-aversion fuelled gold’s strength? Yet risky assets performed well in 2025, with shares in loss-making US companies outperforming those of profitable US firms, and the ‘junkiest’ of junk bonds soaring. Thus, risk aversion can’t be the reason for gold’s strength, either. In fact, the narratives around gold’s strength have been shifting incessantly, from geopolitics to currency debasement; from Central Bank buying to excess global liquidity. New hypotheses abound, but no settled narrative has developed. Recently, the Bank for International Settlements (a well-informed group of economists and bankers, if ever there was one) basically stated that they couldn’t understand gold’s strength.
Many commentators expected a great year for crypto currencies, due to Presidential boosting and supportive new regulation, combined with growing institutional backing. Instead, crypto currencies fell, with Bitcoin, the most prominent of the pack, down by around 13% in Sterling terms. With a total value estimated at over $3 trillion, crypto currencies are probably no longer ‘fringe’ assets. Despite the drop, not all participants lost money: a Reuters examination found that “the US President’s family raked in more than $800 million from sales of crypto assets in the first half of 2025 alone. Much of that cash has come from foreign sources as Donald Trump’s sons have touted their business on an international investor roadshow.”
2025 saw a succession of record highs for stock markets as diverse as Spain, Japan and Indonesia. Even the UK’s FTSE 100 index hit a new all-time high. Furthermore, these markets outperformed the US stock market, despite scant obvious good news and no prevailing narrative as to why they were performing so well. Once again, newsflow did not map through to asset prices. The best explanation for such a banner year might be that these markets started looking rather cheap relative to corporate cash flows.
Portfolios
Client portfolios contain a mix of global shares and bonds, plus gold, cash and some alternative asset funds.
Shares generally performed well, with non-US shares outperforming US shares. This suited our portfolio structure, where we are wary of lofty US valuations and so more exposed to cheaper, non-US markets. Not all shares performed well, though, with many smaller and mid-sized stocks being overlooked, especially in the US, UK and other European markets. Bonds were mostly dull, and this is exactly what we would want and should expect when equities rose to offset volatility and provide stability within the mandates. Major government bonds were fairly stable in price, while delivering moderate yields. Corporate bonds delivered marginally higher returns, albeit with added credit risk.
Gold was the biggest positive in 2025, rising by more than 50%. We hold a modest share of gold in portfolios because it behaves differently from other assets and so offers diversification. Specifically, clients own the Royal Mint Responsibly Sourced Physical Gold Exchange Traded Certificates, where feasible.
We do not put money into crypto currencies, as they are beyond our risk tolerance. We also chose to avoid private equity and credit funds. These are being heavily promoted to investors, but we consider them to have an unattractive set of characteristics today.
Ethical portfolios also performed well in 2025, reinforcing our belief that investing responsibly does not require a trade-off with long-term returns. Our ethical strategies are built around clear exclusions, careful scrutiny of how companies generate their revenues, and a preference for businesses that contribute positively to society or the environment, rather than simply avoiding harm.
During the year, this approach benefited from a recovery in clean energy and environmental solutions companies, as well as solid performance from healthcare, infrastructure and high quality industrial firms that play a role in improving efficiency, safety and sustainability. At the same time, areas typically excluded from ethical portfolios, such as fossil fuels and certain ‘vice’ sectors, were among the weaker parts of global equity markets.
Importantly, ethical investing for us is not just about short-term performance. It is about aligning capital with long-term structural trends such as decarbonisation, resource efficiency, demographic change and improved corporate behaviour. We believe these forces will continue to shape economic growth over many years, allowing clients to pursue competitive returns while also supporting outcomes that reflect their values.
Outlook
Despite having adequate economic growth with above-target inflation, the US is currently subject to both monetary stimulus (via interest rate cuts) and fiscal stimulus (in the form of a huge and sustained government spending deficit). The economy is thus being run ‘hot’… and there’s no sign of any political will for change. In the short run, this double stimulus boosts both corporate profitability and asset prices. But if it carries on for too long, the economy will overheat. This should mean inflation, which would be bad for bonds, and probably bad for equities, too. There is a meaningful risk of rising inflationary expectations in 2026.
As bonds and equities make up the dominant part of most long-term portfolios, any transition to overheating and inflation would be challenging for investors. Fortunately, there are some assets that ‘enjoy’ inflation – such as commodities and, arguably, real estate – and these are available to us. There are also whole groups of shares that seem underpriced or neglected, perhaps due to all the attention and focus currently being put on AI and technology stocks. Neglected groups include emerging market shares; plus Japanese, UK and European mid-sized and smaller firms. These groups might prove resilient to a rotation in markets. We are gradually adding to neglected equities and alternative assets, at a time when many investors are highly concentrated in a small number of large US technology shares.
Our conviction in diversification has been what’s rewarded our strategies the most, along with having patience in “dull” positions and being sceptical about some of the simple, singular narratives around topics such as AI. This discipline will be just as important in 2026, a year which is unlikely to be dull.
The Year in Charts
Global market returns in 2025, in GBP. Gold leads as the US lags major developed peers
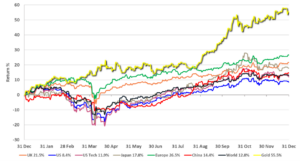
Source: Morningstar. Major global market returns, data in GBP for period 01/01/2025 to 31/12/2025.
Another strong performance from gold as it outperforms equity again in 2025
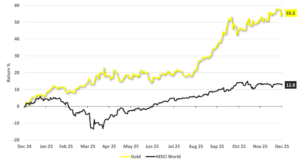 Source: Morningstar. Gold = Royal Mint Responsibly Sourced Physical Gold ETC. Data in GBP for 2025.
Market speculation suggests that AI-related IPOs being discussed could amount to around $1.2 trillion in value – nearly 40% of the UK equity market (!) – highlighting both the scale of capital involved and the growing concentration of risk in a single theme
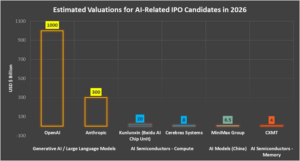
Source: MM Wealth Investment Team. NB. Potential IPO valuations are indicative estimates based on market commentary (Reuters, Bloomberg, Toms Hardware, Financial Times) only; they are not confirmed IPO pricing
Global interest rates are no longer moving in lockstep – policy paths are diverging, and markets are having to adapt
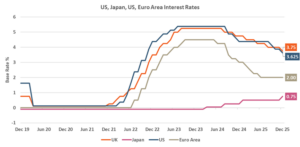
Bank of England, US Federal Reserve, Bank of Japan, European Central Bank. Data for period 31/12/2019 (pre-COVID) to 31/12/2025
Key facts about the world
United Kingdom
- FTSE 100 Best Year Since 2009: The UK’s blue-chip index gained 21.5% in 2025, its strongest annual performance since the aftermath of the financial crisis, outperforming the S&P 500’s 17% return.
- Monetary Policy Easing: The Bank of England cut interest rates four times during 2025, bringing the Bank Rate to 3.75% from 4.75% at the start of the year. Inflation remained elevated at around 3%, above the 2% target.
- House Prices Softening: UK house prices rose just 0.6% annually by December 2025, the slowest growth since April 2024. London prices fell 2.4% year-on-year while Northern Ireland saw the strongest growth at 9.7%.
Europe
- Electric Vehicle Surge: Battery electric vehicle registrations in the EU jumped over 25% in 2025, reaching 1.66 million units by November with market share climbing to 16.9%. Germany led with 434,600 new EV registrations, up 39% year-on-year, while Spain recorded an 89% increase.
- German Infrastructure Investment: After two consecutive years of economic contraction, Germany approved a landmark €500 billion infrastructure fund to stimulate growth from 2026 onwards. The economy stagnated in 2025, with GDP growth essentially flat.
- Labour Market Resilience: Eurozone unemployment held near historic lows at 6.4% in October 2025, demonstrating remarkable labour market resilience despite subdued economic growth and global trade uncertainties.
Asia
- Interest Rate Normalisation: The Bank of Japan raised its policy rate to 0.75% in December, the highest level since 1995, continuing its historic exit from ultra-loose monetary policy. Core inflation remained above the 2% target at 2.9% for the 44th consecutive month.
- Property Crisis Deepens: Chinese real estate investment declined 14.7% in the first ten months of 2025, with new home sales projecting an 8% full-year decrease, the fifth consecutive year of negative growth. Vanke, a state-backed developer, became the first to request bond payment extensions, marking a new phase in the crisis.
- China Youth Unemployment: Urban youth unemployment (ages 16-24, excluding students) stood at 16.9% in November 2025, down from a peak of 18.9% but remaining elevated. The government raised its fiscal deficit target to 4% of GDP, the highest since 2010.
North America
- National Debt Record: US national debt reached $38 trillion in October 2025 during a 42-day government shutdown, rising at an average rate of $6.12 billion per day. Total debt now equals approximately 123% of GDP, the highest since the aftermath of World War II.
- Interest Payments Surge: Net interest on federal debt reached $981 billion in the 12 months to October 2025, nearly triple the $345 billion paid in 2020. Interest payments now exceed national defence spending and have become one of the largest line items in the federal budget.
- Labour Market Cooling: US unemployment rose to 4.6% by November 2025, a four-year high. The Federal Reserve cut interest rates to 3.5-3.75% but signalled only one further cut expected in 2026, reflecting persistent inflation concerns.
South America
- Amazon Deforestation Mixed Fund: Amazon deforestation fell 11% in the year to July 2025, reaching a nine-year low under President Lula’s policies. However, the first half of 2025 saw a 27% increase in deforestation alerts, with over half occurring in recently burned areas as criminals exploited fire-weakened forests.
- COP30 Host: Brazil hosted COP30, the UN climate summit, in Belém in November 2025. The country proposed the Tropical Forest Forever Facility, a $125 billion fund to pay developing nations for forest conservation, though domestic environmental licensing rules were controversially weakened after the summit.
- Interest Rates Soar: Brazil’s Selic rate reached 15% in 2025, the highest since 2006, as the Central Bank battled persistent inflation. The aggressive monetary tightening contributed to GDP growth slowing to 2.2-2.4%, down from 3.4% in 2024.
Africa
- Nigeria Meets OPEC Quota: Nigeria’s crude oil production reached 1.505 million barrels per day (bpd) in June 2025, exceeding its OPEC quota of 1.5 million bpd for the first time since January. Improved pipeline security and reduced oil theft drove the 16% year-on-year increase, reinforcing Nigeria’s position as Africa’s largest oil producer.
- Based on data released through 2025, Sub-Saharan Africa is estimated to have grown by around 3.8-4.0%, outpacing most advanced economies despite tighter global financial conditions.
- Africa could see regional GDP growth in 2026 outpace Asia for the first time in modern history, with projected rates around 4.4% vs. Asia’s c4.1%, though income per capita gains require sustained higher growth.
Q4 2025 Performance Review
Unconstrained strategies
Key facts
Strong finish to the year, led by commodities, gold and diversified global equities
Broadening equity leadership beyond US mega-cap growth
Japan and Emerging Markets supportive contributors over the year
Bonds provided income and stability rather than capital growth
UK and Europe steadier but positive, with selective strength
Gold again an important contributor and portfolio diversifier
Summary
The final quarter of 2025 reinforced one of the defining themes of the year: markets delivered positive outcomes despite persistent uncertainty in the news-flow. While there was no clear, broad-based year-end “Santa Rally”, risk assets generally advanced, and portfolios benefited from a diversified mix of equities, alternatives and defensive assets.
Gold was once again a standout contributor. The Royal Mint Responsibly Sourced Physical Gold ETC rose by 14.2% in Q4, bringing its full-year return to 55.5% in Sterling terms. This strength came despite moderating inflation and falling energy prices, reinforcing gold’s role as a portfolio diversifier rather than a simple inflation hedge. We continue to hold gold in modest size for its ability to behave differently from both equities and bonds during periods of uncertainty.
Equity returns in Q4 were notably broad-based. Global developed equities delivered steady gains, with the Vanguard FTSE Developed World ETF rising 3.5% over the quarter (12% in 2025), while UK equities also contributed, led by the iShares UK Equity Index (+6.8% and 23.1%) and L&G Europe ex-UK Equity ETF (+6.5% and 20.2%). Importantly, returns were not confined to the largest US technology stocks, with US equity income strategies such as BNY Mellon US Equity Income (+5.2% and 11.3%) providing a more balanced source of returns. Following this strong year for global equities, we modestly reduced market exposure towards the end of Q4 by trimming the Vanguard FTSE Developed World ETF. This was reallocated to the Trojan Ethical fund, a cautiously positioned multi-asset fund, to help protect an element of the gains and adopt a slightly more defensive stance heading into 2026.
Outside the US, Emerging Markets and Japan continued to play a constructive role within portfolios. The Vanguard Global Emerging Markets fund rose 6.2% in Q4, contributing to a strong full-year gain of 28.9%, supported by improved valuations and a weaker US Dollar. Japanese equities were more subdued during the quarter, with the Zennor Japan fund down 3.0%, but still ending the year positively (+16.2%) and remaining an important diversifier given ongoing domestic economic reform and rising inflation.
UK and European equities also made positive contributions, albeit more modestly than global peers. UK equity income and smaller company exposure provided resilience, with Jupiter UK Dynamic Equity rising 4.8% in Q4 (and 23.9%), while European equities benefited from improving sentiment towards valuation-led opportunities. Despite ongoing political and economic uncertainty, these regions remain attractively valued and continue to feature meaningfully in portfolios.
Within fixed income, returns were mixed. Shorter-dated government and corporate bonds delivered modest positive outcomes, helping to stabilise portfolios during bouts of volatility. The Amundi UK Government Bond ETF rose 3.1% in Q4 (and 4.9%), while the Artemis Corporate Bond gained 2.6% (and 7.5%). By contrast, index-linked and longer-duration bonds were more sensitive to shifts in inflation expectations, with the L&G All Stocks Index-Linked Gilt Index rising 3.4% in Q4 (and 1.1%) but remaining a more volatile area over the year as a whole. Despite this, bonds continue to play an important defensive role, providing income and diversification at a time of elevated macroeconomic risk. As a result and taking advantage of shifting currency dynamics and relative yields as central banks diverge in policy timing, we also switched a portion of US short-dated Treasury exposure into UK short-dated gilts in Q4. This maintains the defensive characteristics while reducing currency exposure and positioning portfolios conservatively for the year ahead.
Overall, Q4 rounded out a strong year for Unconstrained strategies. Performance was driven less by bold tactical calls and more by diversification, valuation discipline and avoiding excessive concentration in the most crowded areas of the market. These principles remain central to portfolio construction as we move into 2026.
| SECTOR | Q4 2025 | 1 year to 31/12/25 | 1 year to 31/12/24 | 1 year to 31/12/23 | 1 year to 31/12/22 | 1 year to 31/12/21 | 5 years (annualised) |
|---|---|---|---|---|---|---|---|
| IA UK Index Linked Gilts | 3.8% | 0.9% | -9.6% | 0.5% | -35.3% | 3.9% | -9.2% |
| IA £ Corporate Bond | 2.4% | 7.0% | 2.6% | 9.3% | -16.4% | -2.0% | -0.3% |
| IA Property | 0.4% | -0.2% | 0.4% | -0.5% | -7.8% | 7.4% | -0.2% |
| IA UK Equity Income | 5.6% | 18.4% | 8.7% | 7.1% | -2.2% | 18.3% | 9.8% |
| IA UK Smaller Companies | -0.3% | 4.0% | 6.3% | 0.4% | -25.6% | 20.6% | -0.1% |
| IA North America | 2.1% | 6.8% | 22.0% | 16.7% | -10.1% | 25.2% | 11.4% |
| IA Europe Excluding UK | 4.9% | 22.2% | 1.8% | 14.3% | -8.9% | 15.6% | 8.4% |
| IA Japan | 3.0% | 17.5% | 8.6% | 11.0% | -8.4% | 1.6% | 5.7% |
| IA Asia Pacific Excluding Japan | 3.6% | 19.4% | 10.0% | -0.9% | -6.8% | 1.5% | 4.2% |
| IA Global Emerging Markets | 4.6% | 22.1% | 8.0% | 4.3% | -12.3% | -0.3% | 3.7% |
Source: Morningstar in GBP. Net income reinvested. Past performance is not a reliable indicator of future results.
The positioning of our Unconstrained strategies
Cautious
Growth
Balanced
Adventurous
Q4 2025 Performance Review
Ethical strategies
Key facts
Positive quarter for ethical strategies despite continued geopolitical and political uncertainty
Broad-based equity gains across UK, Europe and global ESG funds
Gold again a strong contributor and diversifier
Infrastructure and sustainable assets provided resilience
Bonds mixed, but continued to support portfolio stability
Ethical portfolios delivered competitive full-year returns while remaining aligned with client values
Summary
Ethical strategies delivered positive outcomes in the final quarter of 2025, benefiting from broad-based equity gains and diversification across asset classes. As with our unconstrained strategies, performance was achieved despite an unsettled global backdrop, reinforcing our view that ethical investing can deliver competitive returns without compromising on values.
Gold was again a meaningful contributor within ethical portfolios. The Royal Mint Responsibly Sourced Physical Gold ETC rose 14.2% in Q4, taking its full-year return to 55.5%, and continued to provide valuable diversification at a time when inflation pressures were easing and energy prices were falling. Its performance reinforced gold’s role as a strategic diversifier rather than a simple inflation hedge.
Equity returns were broad-based across ethical strategies. UK and European equities performed well, led by the Amundi MSCI UK IMI SRI Climate Paris Aligned ETF (+6.6% in Q4 and 24.6% for 2025) and EdenTree European Equity (+6.2%) over the quarter (and 33.7%). Global ESG exposure also contributed positively, with the BNY Mellon Global Equity Income (Responsible) fund rising 6.6% in Q4 (and 19.8%), supporting income-focused returns while maintaining a responsible investment framework. These outcomes reflected a recovery in several areas aligned with sustainability themes, including healthcare, infrastructure and higher-quality industrial companies.
Over the full year, ethical equity strategies continued to perform strongly. Funds such as Vanguard ESG Developed World (+12.2%), Janus Henderson UK Responsible Income (+18.2%), and Trojan Ethical (+10.2%) delivered solid annual returns, demonstrating that a disciplined ethical approach remained well aligned with long-term investment objectives during a year dominated by shifting market narratives.
Within alternatives and real assets, infrastructure exposure provided resilience. The Gravis UK Infrastructure fund rose 1.6% in Q4, ending the year up 8.4%, while sustainable bond and real asset strategies continued to offer diversification benefits alongside income generation.
Fixed income returns were mixed but supportive. Shorter-dated and high-quality sustainable bond funds delivered modest positive outcomes, helping to stabilise portfolios during periods of volatility. The Liontrust Sustainable Future Corporate Bond fund rose 3.0% in Q4 (and 7.6%), while Rathbone Ethical Bond gained 2.6% (and 7.5%), reinforcing the defensive characteristics of ethical fixed income allocations. As with unconstrained strategies, bonds continued to play an important role in providing diversification and capital stability.
Overall, Q4 rounded out a strong year for ethical strategies. Performance reflected diversification, valuation discipline and a focus on high-quality businesses aligned with long-term structural trends, rather than reliance on any single market theme. We remain confident that ethical portfolios are well positioned to deliver competitive returns while supporting outcomes that align with our clients’ values as we move into 2026.
| SECTOR | Q4 2025 | 1 year to 31/12/25 | 1 year to 31/112/24 | 1 year to 31/12/23 | 1 year to 31/12/22 | 1 year to 31/12/21 | 5 years (annualised) |
|---|---|---|---|---|---|---|---|
| Global Sustainable | 0.9% | 8.3% | 15.6% | 12.9% | -10.0% | 19.7% | 8.8% |
| UK ESG Enhanced | 6.5% | 20.2% | 10.2% | 10.8% | -3.7% | 19.0% | 10.9% |
| US ESG Enhanced | 2.4% | 9.4% | 26.3% | 20.0% | -11.1% | 29.8% | 13.8% |
| Developed Market Europe Sustainable | 5.3% | 21.0% | 4.4% | 13.7% | -11.4% | 20.3% | 8.9% |
| Emerging Market ESG Enhanced | 4.8% | 18.9% | 5.4% | 2.2% | -11.1% | -2.6% | 2.1% |
| UK Corporate Bond Sustainable | 2.9% | 6.7% | 1.2% | 9.6% | -20.7% | -3.4% | -1.9% |
| Global Corporate Bond Sustainable | 0.6% | 2.5% | 2.2% | 3.4% | -6.9% | -2.7% | -0.4% |
| Global Green Bond | 0.5% | 5.4% | -1.0% | 4.4% | -13.0% | -7.0% | -2.5% |
| Global Renewable Energy | 2.3% | 16.7% | 1.4% | 1.9% | -1.2% | 12.0% | 5.9% |
Source: Morningstar sustainable indices in GBP. Net income reinvested. Past performance is not a reliable indicator of future results
The positioning of our Ethical strategies
Cautious
Growth
Balanced
Adventurous
Disclaimer
Opinions constitute our judgment as of this date and are subject to change without warning. The value of investments, and the income from them, can go down as well as up, and you may not recover the amount of your original investment. Past performance is not a reliable indicator of future results and forecasts are not a reliable indicator of future performance. Where an investment involves exposure to a foreign currency, changes in rates of exchange may cause the value of the investment, and the income from it, to go up or down. The information in this document is not intended as an offer or solicitation to buy or sell securities or any other investment, nor does it constitute a personal recommendation.